DataViz

Sort options

Share Data Through the Art of Visualization (Coursera)

May 7th 2024
Share Data Through the Art of Visualization (Coursera)
Course Auditing
Categories
Effort
Languages
This is the sixth course in the Google Data Analytics Certificate. These courses will equip you with the skills needed to apply to introductory-level data analyst jobs. You’ll learn how to visualize and present your data findings as you complete the data analysis process. This course will show you [...]

Foundations: Data, Data, Everywhere (Coursera)

May 7th 2024
Foundations: Data, Data, Everywhere (Coursera)
Course Auditing
Categories
Effort
Languages
This is the first course in the Google Data Analytics Certificate. These courses will equip you with the skills you need to apply to introductory-level data analyst jobs. Organizations of all kinds need data analysts to help them improve their processes, identify opportunities and trends, launch new products, and [...]

Data Visualization with Python (Coursera)

In today's data-driven world, the ability to create compelling visualizations and tell impactful stories with data is a crucial skill. This comprehensive course will guide you through the process of visualization using coding tools with Python, spreadsheets, and BI (Business Intelligence) tooling. Whether you are a data analyst, a [...]

Business Intelligence and Visual Analytics (Coursera)

Building on “Data Warehousing and Business Intelligence,” this course focuses on data visualization and visual analytics. Starting with a thorough coverage of what data visualization is and what type of visualization is good for a given purpose, the course quickly dives into development of practical skills and knowledge about [...]

Fundamentals of Data Visualization (Coursera)

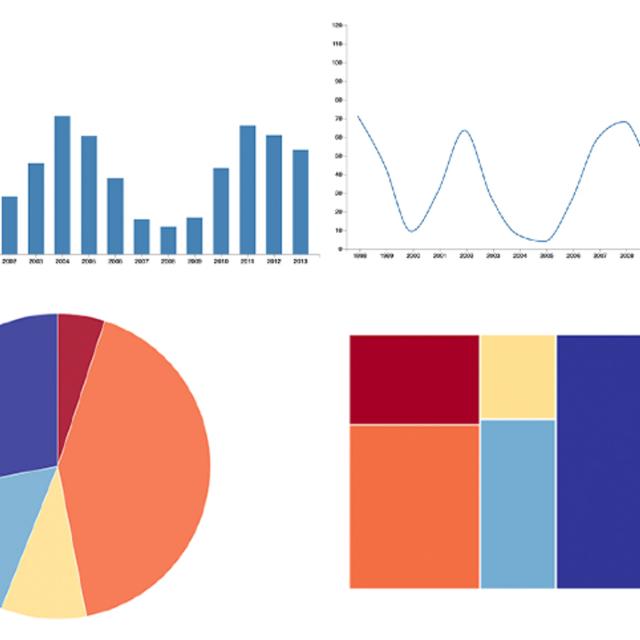
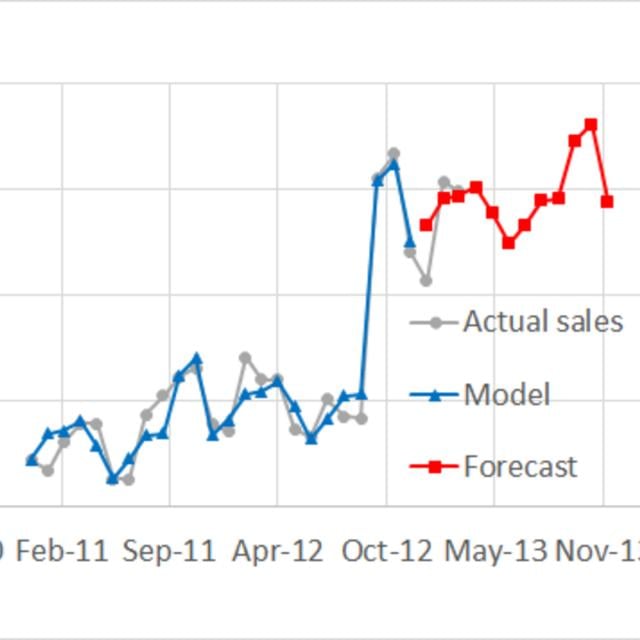
Data is everywhere. Charts, graphs, and other types of information visualizations help people to make sense of this data. This course explores the design, development, and evaluation of such information visualizations. By combining aspects of design, computer graphics, HCI, and data science, you will gain hands-on experience with creating [...]

Data Visualization with R (Coursera)

May 6th 2024
Data Visualization with R (Coursera)
Course Auditing
Categories
Effort
Languages
In this course, you will learn the Grammar of Graphics, a system for describing and building graphs, and how the ggplot2 data visualization package for R applies this concept to basic bar charts, histograms, pie charts, scatter plots, line plots, and box plots. You will also learn how to [...]

Introduction to the Tidyverse (Coursera)

This course introduces a powerful set of data science tools known as the Tidyverse. The Tidyverse has revolutionized the way in which data scientists do almost every aspect of their job. We will cover the simple idea of "tidy data" and how this idea serves to organize data for [...]

Data Visualization in Excel (Coursera)

May 6th 2024
Data Visualization in Excel (Coursera)
Course Auditing
Categories
Effort
Languages
In an age now driven by "big data", we need to cut through the noise and present key information in a way that can be quickly consumed and acted upon making data visualization an increasingly important skill. Visualizations need to not only present data in an easy to understand [...]

Data – What It Is, What We Can Do With It (Coursera)

This course introduces students to data and statistics. By the end of the course, students should be able to interpret descriptive statistics, causal analyses and visualizations to draw meaningful insights. The course first introduces a framework for thinking about the various purposes of statistical analysis. We’ll talk [...]

Demand Analytics (Coursera)

Welcome to Demand Analytics - one of the most sought-after skills in supply chain management and marketing! Through the real-life story and data of a leading cookware manufacturer in North America, you will learn the data analytics skills for demand planning and forecasting.