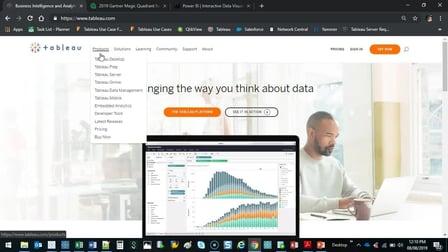
In this short course, I'll show you what Tableau is, how it fits into our lives and finally the basic functions you'll need to get started with this amazing Business Intelligence Solution. You'll hear the explanation that Tableau is Excel on steroids. This explanation isn't the best. I like to think of it as Excel being a car and Tableau being a Boeing 747.
They're both transportation vehicles but getting from A to B is a completely different story.
Enroll now to see this amazing tool in action!
Project Description
We'll be using the very famous Superstore Tableau data set. With this simple data alone, you'll be able to quickly create your visualizations.
We'll be covering:
- Raw data connections using Drag and Drop
- Basic visualizations: Bar, Column, Pie and Line
- Data Visualization Que's: Colour, Labels and Tooltips
- Quick Tableau Calculations: Running Total, Moving Average and More
- Dashboard Creation
- Basic Formatting
- Traditional: Analysis vs. Modern Business Intelligence
Go to Class
MOOC List is learner-supported. When you buy through links on our site, we may earn an affiliate commission.