Segment your market using factor analysis with R programming (Coursera)

Segment your market using factor analysis with R programming (Coursera)

If you ever thought of starting a new business or launching a new product, you’d probably already asked yourself: which type of products are the customers ordering? What type of competition are the products facing in this market? To answer these questions objectively, you can apply Factor Analysis to identify how many and which are the segments in your market. When a company organizes its product line to cover all the attractive market segments and to avoid product overlapping, profitability is more secure.

Class Deals by MOOC List - Click here and see Coursera's Active Discounts, Deals, and Promo Codes.

By the end of this project, you will create a market segmentation by applying Q-type Factor Analysis with R Programming. This guided project is for Business and/or Economics students, entrepreneurs, marketing analysts and anyone else interested in improving product planning and trading strategies by applying quantitative methods to support the decision making process. The prerequisites are familiarity with the concepts of market segmentation, multivariate analysis and R programming.

In this Guided Project, you will:

  • Create a factor analysis model with R programming
  • Use the results of the factor analysis to identify the market segments

Learn step-by-step

  1. Introduction and data preparation
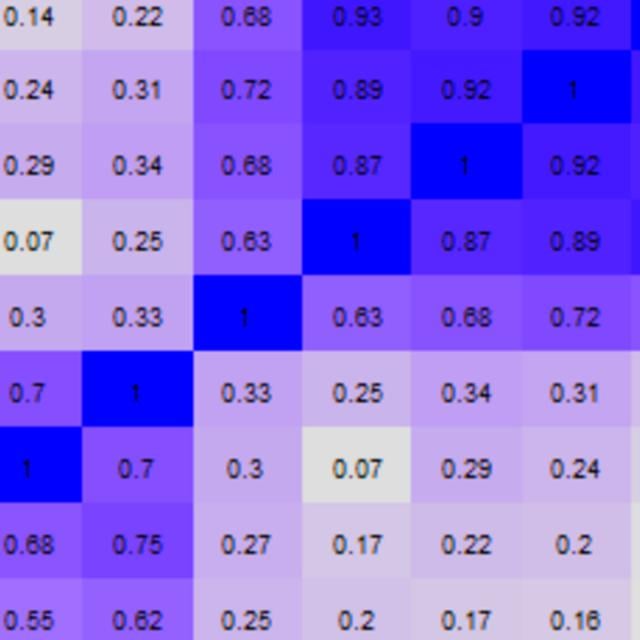
  2. Calculating the correlation matrix and testing for the assumptions
  3. Extracting and determining the number of factors
  4. Setting the number of factors and evaluating the overall adjustment
  5. Improving the model adjustment
  6. Visualizing and interpreting the results
Go to Class
MOOC List is learner-supported. When you buy through links on our site, we may earn an affiliate commission.

Related Courses

Population Health: Predictive Analytics (Coursera) Coursera
Leiden University

Population Health: Predictive Analytics (Coursera)

Predictive analytics has a longstanding tradition in medicine. Developing better prediction models is a critical step in the pursuit of improved health care: we need these tools to guide our decision-making on preventive measures, and individualized treatments. In order to effectively use and develop these models, we must understand them better. In this course, you will learn how to make accurate prediction tools, and how to assess their validity. First, we will discuss the role of predictive analytics for prevention, diagnosis, and effectiveness. Then, we look at key concepts such as study design, sample size and overfitting.

Jun 8th 2026
4 Weeks
Framework for Data Collection and Analysis (Coursera) Coursera
University of Maryland, College Park

Framework for Data Collection and Analysis (Coursera)

This course will provide you with an overview over existing data products and a good understanding of the data collection landscape. With the help of various examples you will learn how to identify which data sources likely matches your research question, how to turn your research question into measurable pieces, and how to think about an analysis plan.

Jun 8th 2026
4 Weeks
Introduction to Data Science in Python (Coursera) Coursera
University of Michigan

Introduction to Data Science in Python (Coursera)

This course will introduce the learner to the basics of the python programming environment, including fundamental python programming techniques such as lambdas, reading and manipulating csv files, and the numpy library. The course will introduce data manipulation and cleaning techniques using the popular python pandas data science library and introduce the abstraction of the Series and DataFrame as the central data structures for data analysis, along with tutorials on how to use functions such as groupby, merge, and pivot tables effectively. By the end of this course, students will be able to take tabular data, clean it, manipulate it, and run basic inferential statistical analyses.

Jun 8th 2026
4 Weeks
Communicating Data Science Results (Coursera) Coursera
University of Washington

Communicating Data Science Results (Coursera)

Making predictions is not enough! Effective data scientists know how to explain and interpret their results, and communicate findings accurately to stakeholders to inform business decisions. Visualization is the field of research in computer science that studies effective communication of quantitative results by linking perception, cognition, and algorithms to exploit the enormous bandwidth of the human visual cortex. In this course you will learn to recognize, design, and use effective visualizations.

Jun 8th 2026
3 Weeks
Getting started with TensorFlow 2 (Coursera) Coursera
Imperial College London

Getting started with TensorFlow 2 (Coursera)

Welcome to this course on Getting started with TensorFlow 2! In this course you will learn a complete end-to-end workflow for developing deep learning models with Tensorflow, from building, training, evaluating and predicting with models using the Sequential API, validating your models and including regularisation, implementing callbacks, and saving and loading models.

Jun 8th 2026
5-12 Weeks
The Structured Query Language (SQL) (Coursera) Coursera
University of Colorado Boulder

The Structured Query Language (SQL) (Coursera)

In this course you will learn all about the Structured Query Language ("SQL".) We will review the origins of the language and its conceptual foundations. But primarily, we will focus on learning all the standard SQL commands, their syntax, and how to use these commands to conduct analysis of the data within a relational database. Our scope includes not only the SELECT statement for retrieving data and creating analytical reports, but also includes the DDL ("Data Definition Language") and DML ("Data Manipulation Language") commands necessary to create and maintain database objects.

Jun 9th 2026
5-12 Weeks
Foundations of strategic business analytics (Coursera) Coursera
ESSEC Business School

Foundations of strategic business analytics (Coursera)

Who is this course for? This course is designed for students, business analysts, and data scientists who want to apply statistical knowledge and techniques to business contexts. For example, it may be suited to experienced statisticians, analysts, engineers who want to move more into a business role. You will find this course exciting and rewarding if you already have a background in statistics, can use R or another programming language and are familiar with databases and data analysis techniques such as regression, classification, and clustering.

Jun 8th 2026
4 Weeks
Regression Models (Coursera) Coursera
Johns Hopkins University

Regression Models (Coursera)

Linear models, as their name implies, relates an outcome to a set of predictors of interest using linear assumptions. Regression models, a subset of linear models, are the most important statistical analysis tool in a data scientist’s toolkit. This course covers regression analysis, least squares and inference using regression models.

Jun 8th 2026
4 Weeks
Introduction to Machine Learning (Coursera) Coursera
Duke University

Introduction to Machine Learning (Coursera)

This course will provide you a foundational understanding of machine learning models (logistic regression, multilayer perceptrons, convolutional neural networks, natural language processing, etc.) as well as demonstrate how these models can solve complex problems in a variety of industries, from medical diagnostics to image recognition to text prediction.

Jun 12th 2026
5-12 Weeks
Reproducible Research (Coursera) Coursera
Johns Hopkins University

Reproducible Research (Coursera)

This course focuses on the concepts and tools behind reporting modern data analyses in a reproducible manner. Reproducible research is the idea that data analyses, and more generally, scientific claims, are published with their data and software code so that others may verify the findings and build upon them. The need for reproducibility is increasing dramatically as data analyses become more complex, involving larger datasets and more sophisticated computations.

Jun 8th 2026
4 Weeks