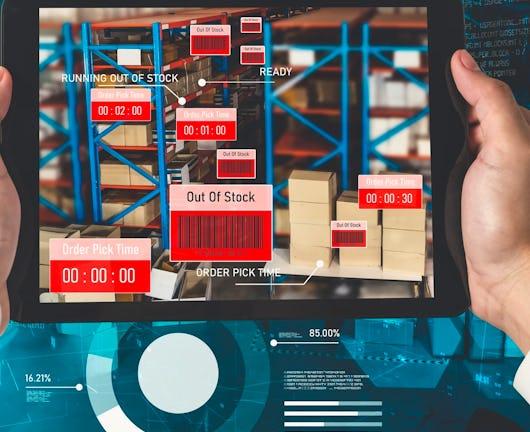
In the Using Data Analytics in Supply Chain course, you’ll explore the importance of data governance, and learn the fundamental concepts surrounding data. You’ll also learn the tools and processes employed in supply chain analytics, enabling you to gather, analyze, synthesize, validate, and interpret data-driven insights. This ensures that products are efficiently delivered to their destination in a timely and cost-effective manner.
Class Deals by MOOC List - Click here and see Coursera's Active Discounts, Deals, and Promo Codes.
By the end of this course, you’ll be able to:
Explain the importance of data governance and adhere to data governance policies.
Define data analysis objectives, formulate questions, pinpoint data sources, and implement effective data gathering techniques.
Conduct data analysis by applying calculations, summarizations, averages, and classification of information to answer the identified data analysis objectives and questions.
Identify how to use SQL, Python, or spreadsheets to clean, manage, consolidate, analyze, and visualize data.
Differentiate between various scenarios and construct simulations to evaluate outcomes.
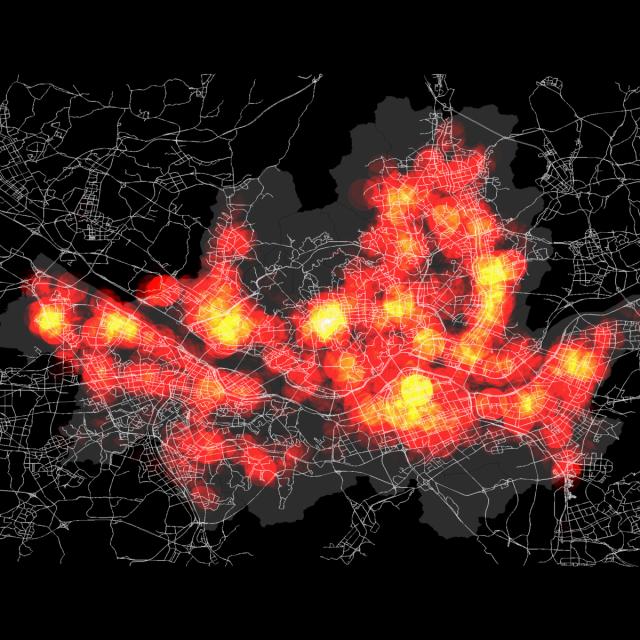
Use data visualization to present insights effectively to decision-makers.
This course is part of the Unilever Supply Chain Data Analyst Professional Certificate.
Syllabus
Data basics and why data governance matters
In this module, you will focus on the importance of analyzing quality data and how to adhere to data governance policies. You'll be introduced to the data analysis process and the tools used to analyze data. Identify the importance of data quality. Identify the types of data. Explain the importance of data governance and adhere to data governance policies.
Define and prepare the data
In this module, you will focus on how to write the objectives of your analysis, identify the questions you should be answering with the data, determine where to obtain your data, and how to clean and prepare the data obtained.
Analyze, validate, and interpret the data
In this module, you will focusing on finding the answers to the identified analysis questions, identifying if errors are present in our analys and making and needed adjustments, intepreting the results and explaining what it means in your own words, and reporting your findings.
Data visualization
In this module, you will learn how to use data visualization tools and storytelling to describe the data to decision makers in a clear, concise and comprehensive manner.
Present the data to your audience
This module focuses on how to create a meaningful presentation for your audience and provides you with the skills to present your findings with confidence.