Learn how statistics plays a central role in the data science approach. This statistics and data analysis course will pave the statistical foundation for our discussion on data science. You will learn how data scientists exercise statistical thinking in designing data collection, derive insights from visualizing data, obtain supporting evidence for data-based decisions and construct models for predicting future trends from data.
Class Deals by MOOC List - Click here and see EdX's Active Discounts, Deals, and Promo Codes.
What you'll learn:
- Data collection, analysis and inference
- Data classification to identify key traits and customers
- Conditional Probability-How to judge the probability of an event, based on certain conditions
- How to use Bayesian modeling and inference for forecasting and studying public opinion
- Basics of Linear Regression
- Data Visualization: How to create use data to create compelling graphics
This course is part of the Data Science for Executives Professional Certificate.
Course Syllabus
Week 1 – Introduction to Data Science
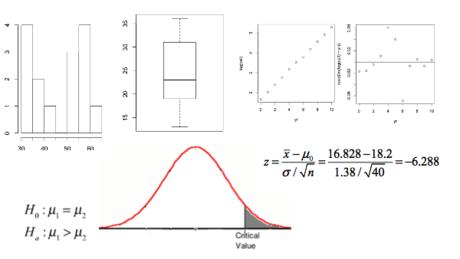
Week 2 – Statistical Thinking
- Examples of Statistical Thinking
- Numerical Data, Summary Statistics
- From Population to Sampled Data
- Different Types of Biases
- Introduction to Probability
- Introduction to Statistical Inference
Week 3 – Statistical Thinking 2
- Association and Dependence
- Association and Causation
- Conditional Probability and Bayes Rule
- Simpsons Paradox, Confounding
- Introduction to Linear Regression
- Special Regression Models
Week 4 – Exploratory Data Analysis and Visualization
Goals of statistical graphics and data visualization
Graphs of Data
Graphs of Fitted Models
Graphs to Check Fitted Models
What makes a good graph?
Principles of graphics
Week 5 – Introduction to Bayesian Modeling
Bayesian inference: combining models and data in a forecasting problem
Bayesian hierarchical modeling for studying public opinion
Bayesian modeling for Big Data