Introduction to Statistics & Data Analysis in Public Health (Coursera)

Introduction to Statistics & Data Analysis in Public Health (Coursera)

This course will teach you the core building blocks of statistical analysis - types of variables, common distributions, hypothesis testing - but, more than that, it will enable you to take a data set you've never seen before, describe its keys features, get to know its strengths and quirks, run some vital basic analyses and then formulate and test hypotheses based on means and proportions. You'll then have a solid grounding to move on to more sophisticated analysis and take the other courses in the series.

Class Deals by MOOC List - Click here and see Coursera's Active Discounts, Deals, and Promo Codes.

You'll learn the popular, flexible and completely free software R, used by statistics and machine learning practitioners everywhere. It's hands-on, so you'll first learn about how to phrase a testable hypothesis via examples of medical research as reported by the media. Then you'll work through a data set on fruit and vegetable eating habits: data that are realistically messy, because that's what public health data sets are like in reality. There will be mini-quizzes with feedback along the way to check your understanding. The course will sharpen your ability to think critically and not take things for granted: in this age of uncontrolled algorithms and fake news, these skills are more important than ever.
Course 1 of 4 in the Statistical Analysis with R for Public Health Specialization.

Prerequisites
Some formulae are given to aid understanding, but this is not one of those courses where you need a mathematics degree to follow it. You will need only basic numeracy (for example, we will not use calculus) and familiarity with graphical and tabular ways of presenting results. No knowledge of R or programming is assumed.

What You Will Learn

  • Defend the critical role of statistics in modern public health research and practice
  • Describe a data set from scratch, including data item features and data quality issues, using descriptive statistics and graphical methods in R
  • Select and apply appropriate methods to formulate and examine statistical associations between variables within a data set in R
  • Interpret the output from your analysis and appraise the role of chance and bias

Syllabus

WEEK 1
Introduction to Statistics in Public Health
Statistics has played a critical role of in public health research and practice, and you’ll start by looking at two examples: one from eighteenth century London and the other by the United Nations. The first task in carrying out a research study is to define the research question and express it as a testable hypothesis. With examples from the media, you’ll see what does and does not work in this regard, giving you a chance to define a research question from some real news stories.

WEEK 2
Types of Variables, Common Distributions and Sampling
This module will introduce you to some of the key building blocks of knowledge in statistical analysis: types of variables, common distributions and sampling. You’ll see the difference between “well-behaved” data distributions, such as the normal and the Poisson, and real-world ones that are common in public health data sets.

WEEK 3
Introduction to R and RStudio
Now it’s time to get started with the powerful and completely free statistical software R and its popular interface RStudio. With the example of fruit and vegetable consumption, you’ll learn how to download R, import the data set and run essential descriptive analyses to get to know the variables.

WEEK 4
Hypothesis Testing in R
Having learned how to define a research question and testable hypothesis earlier in the course, you’ll learn how to apply hypothesis testing in R and interpret the result. As all medical knowledge is derived from a sample of patients, random and other kinds of variation mean that what you measure on that sample, such as the average body mass index, is not necessarily the same as in the population as a whole. It’s essential that you incorporate this uncertainty in your estimate of average BMI when presenting it. This involves the calculation of a p value and confidence interval, fundamental concepts in statistical analysis. You’ll see how to do this for averages and proportions.


Go to Class
MOOC List is learner-supported. When you buy through links on our site, we may earn an affiliate commission.

Related Courses

Instructional Methods in Health Professions Education (Coursera) Coursera
University of Michigan

Instructional Methods in Health Professions Education (Coursera)

This course provides those involved in educating members of the health professions an asynchronous, interdisciplinary, and interactive way to obtain, expand, and improve their teaching skills. These skills can then be applied within their own professional context, with a variety of learners, extending across many stages.

Aug 24th 2026
5-12 Weeks
MRI Fundamentals (Coursera) Coursera
Korea Advanced Institute of Science and Technology - KAIST

MRI Fundamentals (Coursera)

Welcome! In this course learners will develop expertise in basic magnetic resonance imaging (MRI) physics and principles and gain knowledge of many different data acquisition strategies in MRI. In particular, learners will get to know what is magnetic resonance phenomenon, how magnetic resonance signals are generated, how an image can be formulated using MRI, how soft tissue contrast can change with imaging parameters.

Aug 24th 2026
5-12 Weeks
Systems Science and Obesity (Coursera) Coursera
Johns Hopkins University

Systems Science and Obesity (Coursera)

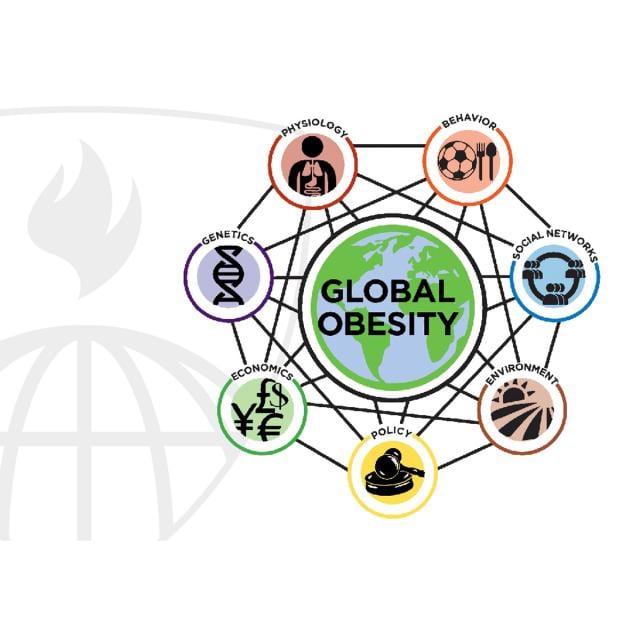
Systems science has been instrumental in breaking new scientific ground in diverse fields such as meteorology, engineering and decision analysis. However, it is just beginning to impact public health. This seminar is designed to introduce students to basic tools of theory building and data analysis in systems science and to apply those tools to better understand the obesity epidemic in human populations.

Aug 24th 2026
4 Weeks
Bioinformatic Methods I (Coursera) Coursera
University of Toronto

Bioinformatic Methods I (Coursera)

Large-scale biology projects such as the sequencing of the human genome and gene expression surveys using RNA-seq, microarrays and other technologies have created a wealth of data for biologists. However, the challenge facing scientists is analyzing and even accessing these data to extract useful information pertaining to the system being studied. This course focuses on employing existing bioinformatic resources – mainly web-based programs and databases – to access the wealth of data to answer questions relevant to the average biologist, and is highly hands-on.

Aug 24th 2026
5-12 Weeks
Nutrition and Lifestyle in Pregnancy (Coursera) Coursera
Ludwig-Maximilians-Universität München

Nutrition and Lifestyle in Pregnancy (Coursera)

Nutrition and Lifestyle in Pregnancy offers an overview of the latest research findings and international recommendations on a variety of nutrition-related aspects and outcomes of pregnancy. Ensuring a healthy nutritional status and lifestyle prior to and during pregnancy is one of the best ways to help support the healthy growth and development of the unborn child. We will look at how a healthy diet and lifestyle should ideally be achieved prior to conception and provide recommendations for pre-conception counselling of women.

Aug 24th 2026
4 Weeks
Understanding the Brain: The Neurobiology of Everyday Life (Coursera) Coursera
University of Chicago

Understanding the Brain: The Neurobiology of Everyday Life (Coursera)

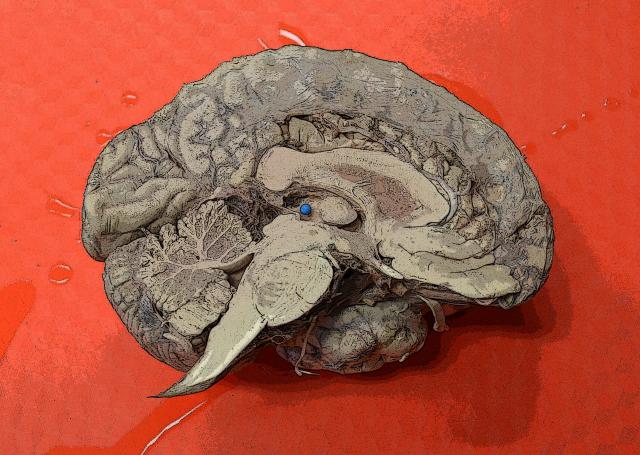
Learn how the nervous system produces behavior, how we use our brain every day, and how neuroscience can explain the common problems afflicting people today. We will study functional human neuroanatomy and neuronal communication, and then use this information to understand how we perceive the outside world, move our bodies voluntarily, stay alive, and play well with others.

Aug 24th 2026
5-12 Weeks
Combining and Analyzing Complex Data (Coursera) Coursera
University of Maryland, College Park

Combining and Analyzing Complex Data (Coursera)

In this course you will learn how to use survey weights to estimate descriptive statistics, like means and totals, and more complicated quantities like model parameters for linear and logistic regressions. Software capabilities will be covered with R® receiving particular emphasis. The course will also cover the basics of record linkage and statistical matching—both of which are becoming more important as ways of combining data from different sources. Combining of datasets raises ethical issues which the course reviews. Informed consent may have to be obtained from persons to allow their data to be linked. You will learn about differences in the legal requirements in different countries.

Aug 24th 2026
4 Weeks