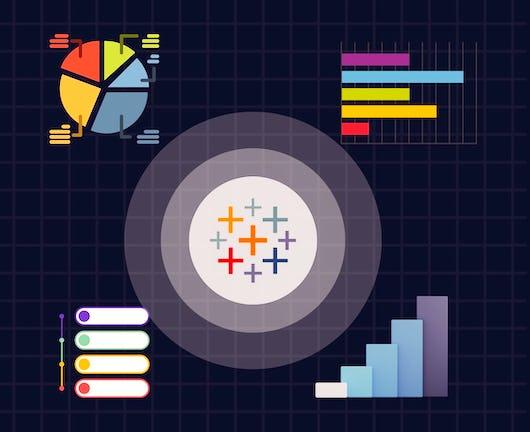
Dive deep into the compelling world of data visualization with this beginner-friendly course, illuminating the art of transforming data into insightful visuals using Tableau. Arranged in four comprehensive modules, this course outlines a clear learning trajectory, transitioning from foundational concepts to advanced visualization techniques.
Class Deals by MOOC List - Click here and see Coursera's Active Discounts, Deals, and Promo Codes.
Dive deep into the compelling world of data visualization with this beginner-friendly course, illuminating the art of transforming data into insightful visuals using Tableau. Arranged in four comprehensive modules, this course outlines a clear learning trajectory, transitioning from foundational concepts to advanced visualization techniques.
In the initial module, the focus is on grasping the essentials of Tableau, the cornerstone of effective data visualization. Here, you'll acquaint yourself with Tableau's fundamental tools and features, setting a solid base for your data storytelling journey.
The subsequent module propels you into the world of data transformation. Dive deep into Tableau's core functionalities, from understanding the dynamics of Marks Cards and Legends to the significant roles of Green and Blue pills. This phase empowers you to mold raw data into compelling visual stories.
Progressing further, the third module introduces you to the vast spectrum of Tableau charts. From basic bar charts to complex visualizations, you'll learn to select the apt visual medium, ensuring your data narratives resonate and captivate.
Concluding your journey, the fourth module immerses you in advanced Tableau techniques and dashboard design. By leveraging sophisticated features and crafting interactive dashboards, you'll be able to present your insights with greater impact.
By the end of the course, not only will you have a portfolio of compelling data visualizations to showcase, but you'll also possess a profound understanding of data visualization principles and a robust proficiency in Tableau.
What you'll learn
- Delve into the essentials of Tableau, mastering installation, interface navigation, and tapping into its potent data visualization features.
- Unlock the nuances of visual communication, translating intricate datasets into lucid, captivating visual narratives aligned with desired stories.
- Differentiate between exploratory and explanatory analysis, leveraging Tableau to unearth insights and effectively disseminate findings.
- Integrate diverse data effortlessly, leveraging Tableau's unparalleled data blending, joining, and computation to create insightful visuals.
Syllabus
Basics of Tableau
This comprehensive course is designed to equip you with the essential skills and knowledge needed to navigate the Tableau ecosystem with confidence and master the art of data visualization. From understanding the fundamental concepts of data visualization to exploring the intricacies of Tableau's user interface and features, this module will empower you to harness the full potential of Tableau for insightful and impactful data analysis.
Fundamentals of Tableau
In this comprehensive course, you will dive deep into the world of data manipulation and visualization using Tableau. From understanding the intricacies of Marks Cards and Legends to mastering the art of data blending and creating calculated fields, this module will empower you with the skills needed to transform raw data into insightful visualizations that drive meaningful insights and informed decision-making.
Tableau Charts: From Basic to Advanced Visualizations
Welcome to the "Tableau Charts: From Basic to Advanced Visualizations" module, where you will embark on a comprehensive journey to become a skilled data storyteller using Tableau. Whether you're new to data visualization or looking to refine your expertise, this module will equip you with the tools to create compelling and insightful visualizations that effectively communicate your data-driven narratives.
Advanced Tableau: Techniques and Dashboard Design
Advanced Tableau: Techniques and Dashboard Design' module, where you will delve into the intricacies of advanced Tableau functionalities and learn to craft captivating dashboards that showcase your data insights in a compelling manner.