EdX

Data Analysis for the Behavioral Sciences (edX)

Data Analysis for the Behavioral Sciences (edX)

How do statistics apply to your life and how can we use statistics to draw conclusions about the world? This course will provide you with an integrated and engaging online experience to explore statistics in the behavioral sciences.

Class Deals by MOOC List - Click here and see EdX's Active Discounts, Deals, and Promo Codes.

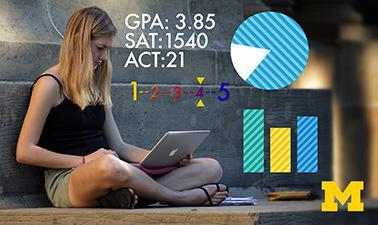
Can you think of an area of your life that is influenced by statistics? Many times when we think about statistics in our daily lives, we think about numerical expressions of statistics, such as the number of daily COVID cases in our county, the percentage of students admitted each year to our university, or the number of people that voted in the last election. From each of these examples, we could go on to make inferences or look to answer questions based on this data, such as whether to open restaurants, how many new students are psychology majors, or if a specific issue drove voters to the polls in a specific state.
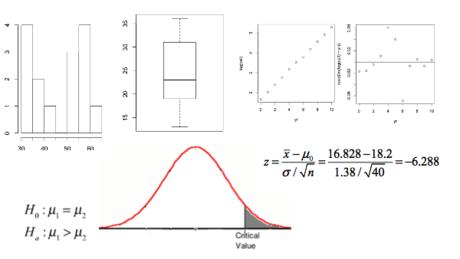
This course will begin by introducing the basic concepts of how to describe and visualize data, the fundamentals of using statistics to make inferences, and the logic of null hypothesis testing. Various types of hypothesis tests will be introduced, along with criteria for selecting which is appropriate for different study conditions. As an extension of null hypothesis significance tests, you will learn about how to interpret effect sizes and confidence intervals, along with statistical power, before being introduced to alternatives to null hypothesis significance testing. All this is fleshed out in Data Analysis for the Behavioral Sciences.
This course is part of the Research Methods in Psychology Professional Certificate.

What you'll learn

  • Explain various ways to categorize variables.
  • Explain various ways to describe data.
  • Describe how graphs are used to visualize data.
  • Explain the meaning of a correlation coefficient.
  • Describe the logic of inferential statistics.
  • Explain the logic of null hypothesis significance testing.
  • Select the appropriate inferential test based on study criteria.
  • Compare and contrast the use of statistical significance, effect size, and confidence intervals.
  • Explain the importance of statistical power.
  • Describe how alternative procedures address the major objections to null hypothesis significance testing.

Syllabus

Data Analysis for the Behavioral Sciences

  • Learning Plan

Data Analysis Basics

  • Variables and Measures
  • Describing Data
  • Section Summary

Null Hypothesis Significance Testing

  • Inferential Statistics
  • Null Hypothesis Significance Testing
  • The Variety of Null Hypothesis Significance Tests

Beyond Null Hypothesis Significance Testing

  • Preview
  • The “New Statistics”
  • Statistical Power
  • Alternatives to Null Hypothesis Significance Testing

Course Summary

  • Explain various ways to categorize variables
  • Explain various ways to describe data
  • Explain the meaning of a correlation coefficient
  • Describe the logic of inferential statistics
  • Explain the logic of null hypothesis significance testing
  • Select the appropriate inferential test based on study criteria
  • Compare and contrast the use of statistical significance, effect size, and confidence intervals
  • Explain the importance of statistical power
Go to Class
MOOC List is learner-supported. When you buy through links on our site, we may earn an affiliate commission.

Related Courses

Introduction to Statistics: Descriptive Statistics (edX) EdX
University of California, Berkeley,BerkeleyX

Introduction to Statistics: Descriptive Statistics (edX)

An introduction to descriptive statistics, emphasizing critical thinking and clear communication. We are surrounded by information, much of it numerical, and it is important to know how to make sense of it. Stat2x is an introduction to the fundamental concepts and methods of statistics, the science of drawing conclusions from data.

No sessions available
4 Weeks
Enabling Technologies for Data Science and Analytics: The Internet of Things (edX) EdX
Columbia University,ColumbiaX

Enabling Technologies for Data Science and Analytics: The Internet of Things (edX)

Discover the relationship between Big Data and the Internet of Things (IoT). The Internet of Things is rapidly growing. It is predicted that more than 25 billion devices will be connected by 2020. In this data science course, you will learn about the major components of the Internet of Things and how data is acquired from sensors. You will also examine ways of analyzing event data, sentiment analysis, facial recognition software and how data generated from devices can be used to make decisions.

Self Paced
Self-Paced
Statistics for Business - II (edX) EdX
Indian Institute of Management, Bangalore,IIMBx

Statistics for Business - II (edX)

Examine data drawn from allied fields of business such as Finance and HR, and learn how to simulate data to follow a specified distribution. Statistics is a versatile discipline that has revolutionized the fields of business, engineering, medicine and pure sciences. This course is Part 2 of a 4-part series on Business Statistics, and is ideal for learners who wish to enroll in business programs. The first two parts cover topics in Descriptive Statistics, whereas the next two focus on Inferential Statistics.

No sessions available
5-12 Weeks
Computing for Data Analysis (edX) EdX
Georgia Institute of Technology,GTx

Computing for Data Analysis (edX)

A hands-on introduction to basic programming principles and practice relevant to modern data analysis, data mining, and machine learning. The modern data analysis pipeline involves collection, preprocessing, storage, analysis, and interactive visualization of data. In the course, you’ll see how computing and mathematics come together.

Aug 19th 2024
13-24 Weeks
Introduction to Applied Biostatistics: Statistics for Medical Research (edX) EdX
Osaka University

Introduction to Applied Biostatistics: Statistics for Medical Research (edX)

Learn data analysis for medical research with practical hands-on examples using R Commander. Want to learn how to analyze real-world medical data, but unsure where to begin? This Applied Biostatistics course provides an introduction to important topics in medical statistical concepts and reasoning.

No sessions available
5-12 Weeks
Statistical Thinking for Data Science and Analytics (edX) EdX
Columbia University,ColumbiaX

Statistical Thinking for Data Science and Analytics (edX)

Learn how statistics plays a central role in the data science approach. This statistics and data analysis course will pave the statistical foundation for our discussion on data science. You will learn how data scientists exercise statistical thinking in designing data collection, derive insights from visualizing data, obtain supporting evidence for data-based decisions and construct models for predicting future trends from data.

Self Paced
Self-Paced
Introduction to Linear Models and Matrix Algebra (edX) EdX
HarvardX,Harvard University

Introduction to Linear Models and Matrix Algebra (edX)

Learn to use R programming to apply linear models to analyze data in life sciences. Matrix Algebra underlies many of the current tools for experimental design and the analysis of high-dimensional data. In this introductory data analysis course, we will use matrix algebra to represent the linear models that commonly used to model differences between experimental units. We perform statistical inference on these differences. Throughout the course we will use the R programming language.

Self Paced
Self-Paced