Charts

Sort options

Design and Make Infographics (Project-Centered Course) (Coursera)

In this project-centered course*, you will create a content-rich infographic on a topic of your choice using Adobe Illustrator (which you can download for a free, 30-day trial). You might choose to create a visual representation of data from the world of sports, entertainment, politics, or science, to explain [...]

Habilidades de Excel para negócios: Fundamentos (Coursera)

Neste primeiro curso da especialização Habilidades de Excel para negócios, você aprenderá os fundamentos do Microsoft Excel. Dentro de seis semanas, você poderá navegar habilmente pela interface de usuário do Excel, realizar cálculos básicos com fórmulas e funções, formatar planilhas profissionalmente e criar visualizações de dados por meio de [...]

Compétences Excel pour l’entreprise : les notions clés (Coursera)

Dans ce premier cours de la spécialisation Compétences Excel pour l’entreprise, vous apprendrez les bases de Microsoft Excel. Dans un délai de six semaines, vous serez en mesure de naviguer de manière experte dans l'interface utilisateur d'Excel, d'effectuer des calculs de base avec des formules et des fonctions, de [...]

Data Visualization and Building Dashboards with Excel and Cognos (edX)

Self Paced
Data Visualization and Building Dashboards with Excel and Cognos (edX)
Course Auditing
Categories
Effort
Languages
Build the fundamental knowledge necessary to use Excel and IBM Cognos Analytics to create data visualizations and to create dashboards containing those visualizations to help tell a lucid story about data. This course provides students with the basics required to create data visualizations and dashboards using both Microsoft Excel [...]

Visualizing Data with Python (edX)

Self Paced
Visualizing Data with Python (edX)
Course Auditing
Categories
Effort
Languages
Data visualization is the graphical representation of data in order to interactively and efficiently convey insights to clients, customers, and stakeholders in general. "A picture is worth a thousand words." We are all familiar with this expression. It especially applies when trying to explain the insights obtained from the [...]

Visualização de dados com o Python (Coursera)

"Uma imagem vale mais que mil palavras". Todos conhecemos essa expressão. Ela é válida principalmente quando se tenta explicar algum insight obtido através de análises de conjuntos de dados cada vez maiores. A visualização de dados tem um papel essencial na representação de dados pequenos e de larga [...]

Data Visualisation with Tableau Fundamentals (FutureLearn)

May 23rd 2022
Data Visualisation with Tableau Fundamentals (FutureLearn)
Course Auditing
Categories
Effort
Languages
Learn the fundamentals of data visualisation – from core components to interactive elements. Want to create meaningful data visualisations that fuel decision-making and growth within your business? This course teaches you the basics – from individual elements and relationships through to data preparation in Tableau. You’ll learn design theories [...]

Data Visualisation: Creating Charts and Complex Visualisations in Tableau (FutureLearn)

May 23rd 2022
Data Visualisation: Creating Charts and Complex Visualisations in Tableau (FutureLearn)
Course Auditing
Categories
Effort
Languages
Learn the fundamentals of data visualisation and storytelling to boost your career options. Struggling to turn data insights into action within your organisation? Learn how to identify the right metrics to add to data dashboards and identify the most effective components to help you tell data stories through beautiful [...]

Excel Basics for Data Visualizations (Coursera)

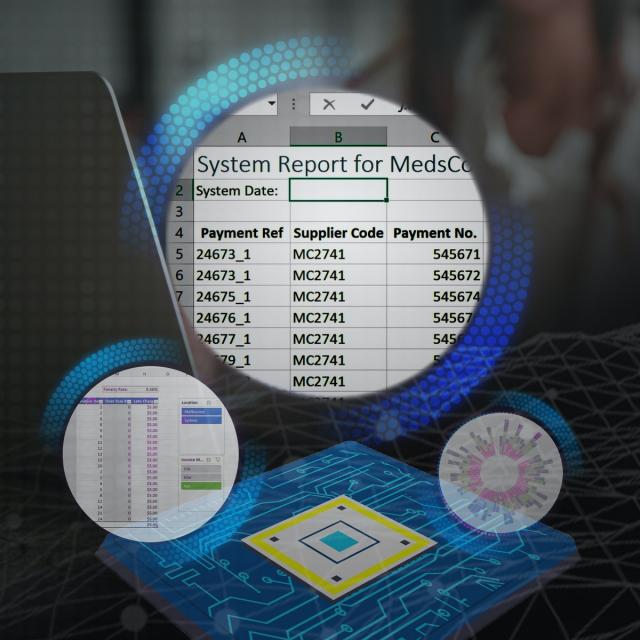
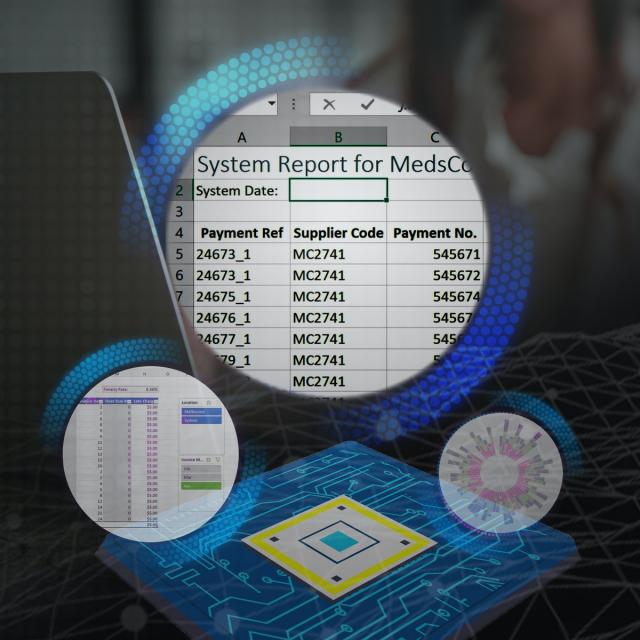
By the end of this project, you will create different types of charts and graphs using Excel spreadsheets and built interactive dashboards. You will acquire basic skills needed to manipulate and create data visualizations and their importance for storytelling. This project is a first step in the development of [...]

Visualizando datos con Python (edX)

Self Paced
Visualizando datos con Python (edX)
Course Auditing
Categories
Effort
Languages
La visualización de datos es la representación gráfica de los datos para transmitir de manera interactiva y eficiente las ideas a los clientes y partes interesadas en general.