This course focuses on how analysts can measure and describe the confidence they have in their findings. The course begins with an overview of the key probability rules and concepts that govern the calculation of uncertainty measures. We’ll then apply these ideas to variables (which are the building blocks of statistics) and their associated probability distributions. The second half of the course will delve into the computation and interpretation of uncertainty. We’ll discuss how to conduct a hypothesis test using both test statistics and confidence intervals. Finally, we’ll consider the role of hypothesis testing in a regression context, including what we can and cannot learn from the statistical significance of a coefficient. By the end of the course, you should be able to discuss statistical findings in probabilistic terms and interpret the uncertainty of a particular estimate.
Class Deals by MOOC List - Click here and see Coursera's Active Discounts, Deals, and Promo Codes.
Course 4 of 5 in the Data Literacy Specialization
Syllabus
WEEK 1
Probability Theory
The Monty Hall problem is a classic brain teaser that highlights the often counterintuitive nature of probability. The problem is typically stated as follows: Suppose you're a contestant on a game show and asked to select one of three doors for your prize. Behind one door is a car and behind the other two doors are goats. You pick one door. The host, who knows what's behind each door, opens another, which has a goat. He then gives you the option to stick with your selected door or switch to the other closed door. What should you do? The answer is that, under these circumstances, you should always switch. There is a 2/3 chance of winning the car if you switch and a 1/3 chance of winning if you stick with your original selection. Most people, however, assume that there is only a 50/50 chance of winning if you switch. Hopefully this brain teaser, and content we cover in this module, will help you better approach probabilistic problems.
WEEK 2
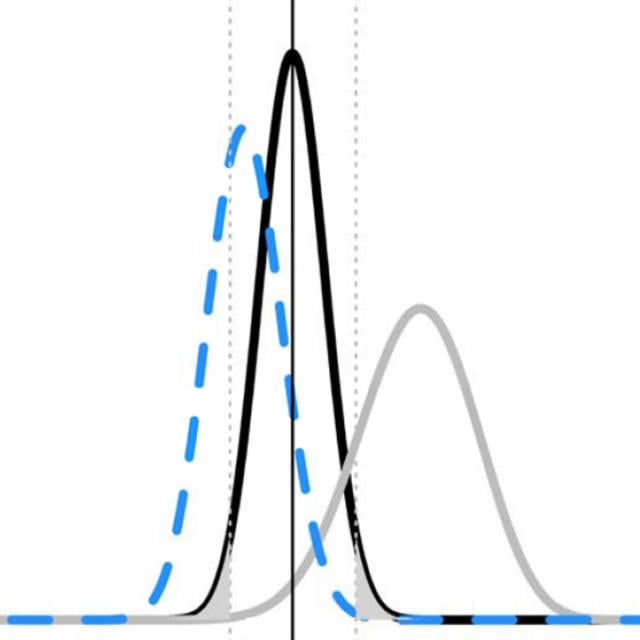
Random Variables and Distributions
In this module, we'll dive into a topic you've likely encountered all of your adult life but perhaps have never explored from a statistical perspective: the normal curve. More generally, we'll discuss probability distributions, including their key features and relevance to quantifying uncertainty. Although studying probability theory can sometimes feel detached from applied statistics, it's valuable to develop a foundational understanding of probability to be able to critically evaluate statistical models. An appreciation for probability, and its counter-intuitive nature, will help you interpret the uncertainty of a statistical result as accurately as possible. This is particularly important when the stakes are high and policy makers want to know whether or not to act based on a statistical finding.
WEEK 3
Confidence Intervals and Hypothesis Testing
In this module we will apply the concepts of probability, random variables and distributions to measuring and interpreting uncertainty. In particular, we'll focus on statistical significance. A relationship is statistically significant if it can be distinguished from zero. Suppose you want to examine the effect of exposure to negative campaign ads on one's likelihood of voting. The independent variable is one's exposure to negative campaign ads and the dependent variable is one's likelihood of voting. If we find that exposure to negative campaign ads has no relationship with the likelihood of voting, we would say that this is a statistically insignificant relationship. If, instead, we find that exposure to negative campaign ads leads to a decline in one's likelihood of voting, we have uncovered a statistically significant (i.e., non-zero) relationship.
WEEK 4
Quantifying Uncertainty in Regression Analysis and Polling
In this final module of the course, we'll cover how to measure the uncertainty of regression estimates and poll results. It is often the case that a regression model will reveal a non-zero relationship, but it's important to determine whether that relationship sufficiently different from zero such that we can conclude that the relationship is statistically significant. For example, suppose a regression model reveals that a drug improves patient outcomes by 3.2%. Is 3.2% statistically different from 0? A statistical significance test will answer this question. This module, however, will also discuss some of the drawbacks of relying a statistical significance for data-driven decision making. While statistical significance is an important consideration, it is not the only criterion one should use when determining whether to act on a set of a statistical findings.