Julia Scientific Programming (Coursera)

Julia Scientific Programming (Coursera)

This four-module course introduces users to Julia as a first language. Julia is a high-level, high-performance dynamic programming language developed specifically for scientific computing. This language will be particularly useful for applications in physics, chemistry, astronomy, engineering, data science, bioinformatics and many more.

Class Deals by MOOC List - Click here and see Coursera's Active Discounts, Deals, and Promo Codes.

As open source software, you will always have it available throughout your working life. It can also be used from the command line, program files or a new type of interface known as a Jupyter notebook.
Julia is designed to address the requirements of high-performance numerical and scientific computing while also being effective for general-purpose programming. You will be able to access all the available processors and memory, scrape data from anywhere on the web, and have it always accessible through any device you care to use as long as it has a browser. Join us to discover new computing possibilities. Let's get started on learning Julia.
By the end of the course you will be able to:

  • Programme using the Julia language by practising through assignments
  • Write your own simple Julia programs from scratch
  • Understand the advantages and capacities of Julia as a computing language
  • Work in Jupyter notebooks using the Julia language
  • Use various Julia packages such as DataFrames, PyPlot and Stats

The course is delivered through video lectures, on-screen demonstrations, quizzes and practical peer-reviewed projects designed to give you an opportunity to work with the packages.

Syllabus

WEEK 1
Welcome to the course
A warm welcome to Julia Scientific Programming. Over the next four weeks, we will provide you with an introduction to what Julia can offer. This will allow you to learn the basics of the language, and stimulate your imagination about how you can use Julia in your own context. This is all about you exploring Julia - we can only demonstrate some of the capacity and encourage you to take the first steps. For those of you with a programming background, the course is intended to offer a jumpstart into using this language. If you are a novice or beginner programmer, you should follow along the simple coding but recognising that working through the material will not be sufficient to make you a proficient programmer in four weeks. You could see this as the ‘first date’ at the beginning of a long and beautiful new relationship. There is so much you will need to learn and discover. Good luck and we hope you enjoy the course! Best wishes, Henri and Juan

WEEK 2
A context for exploring Julia: Working with data
In our case study we use Julia to store, plot, select and slice data from the Ebola epidemic. Taking real data, we explain how to work in Julia using arrays, and for loops to work with the structures. By the end of this module, you will be able to: create an array from data; learn to use the logical structures IF and FOR ; conduct basic array slicing, getting the incidence data and generating total number of cases; use Plots to generate graphs and plot data; and combine the Ebola data outputs to show a plot of disease incidence in several countries.

WEEK 3
Notebooks as Julia Programs
in this week, we demonstrate how it is possible to use Julia in the notebook environment to interpret a model and its fit to the data from the Ebola outbreak. For this, we apply the well-known SIR compartmental model in epidemiology. The SIR model labels three compartments, namely S = number susceptible, I =number infectious, and R =number recovered. By the end of this module, you will be able to: understand the SIR models; describe the basic parameters of an SIR model; plot the model-predicted curve and the data on the same diagram; adjust the parameters of the model so the model-predicted curve is close (or rather as close as you can make it) to the data.

WEEK 4
Structuring data and functions in Julia
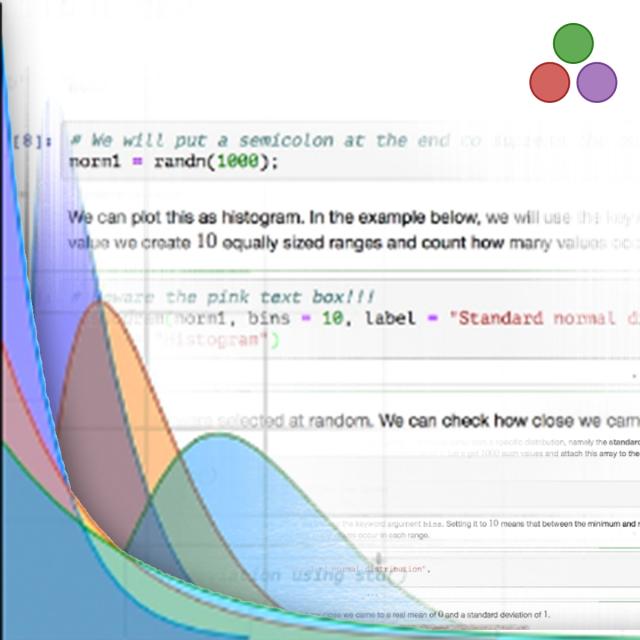
As a scientific computing language, Julia has many applications and is particularly well suited to the task of working with data. In this last module, we will use descriptive statistics as our topic to explore the power of Julia. You should see this week as offering you a chance to further explore concepts introduced in week one and two. You will also be introduced to more efficient ways of managing and visualizing your data. We have also included additional, honors material for those who want to explore further with Julia around functions and collections. By the end of this module, you will be able to: 1. Practice basic functions in Julia 2.Creating random variables from data point values 3. Build your own Dataframes 4. Create a variety of data visualisations 5. Conduct statistical tests 6. learn how to export your data.

Go to Class
MOOC List is learner-supported. When you buy through links on our site, we may earn an affiliate commission.

Related Courses

Data Analysis Tools (Coursera) Coursera
Wesleyan University

Data Analysis Tools (Coursera)

In this course, you will develop and test hypotheses about your data. You will learn a variety of statistical tests, as well as strategies to know how to apply the appropriate one to your specific data and question. Using your choice of two powerful statistical software packages (SAS or Python), you will explore ANOVA, Chi-Square, and Pearson correlation analysis. This course will guide you through basic statistical principles to give you the tools to answer questions you have developed. Throughout the course, you will share your progress with others to gain valuable feedback and provide insight to other learners about their work.

Jun 1st 2026
4 Weeks
Statistical Inference (Coursera) Coursera
Johns Hopkins University

Statistical Inference (Coursera)

Statistical inference is the process of drawing conclusions about populations or scientific truths from data. There are many modes of performing inference including statistical modeling, data oriented strategies and explicit use of designs and randomization in analyses. Furthermore, there are broad theories (frequentists, Bayesian, likelihood, design based, …) and numerous complexities (missing data, observed and unobserved confounding, biases) for performing inference.

Jun 1st 2026
4 Weeks
iOS App Development Basics (Coursera) Coursera
University of Toronto

iOS App Development Basics (Coursera)

iOS App Development Basics, the second course in the iOS App Development with Swift specialization, expands your programming skills and applies them to authentic app development projects. The topics covered in this course include Xcode basics, Core iOS and Cocoa Touch frameworks, simple user interface creation, MVC Architecture and much more. With a focus on using Apple’s components to access sensors like camera, microphone and GPS, by the end of this course you will be able to create a basic App according to specified parameters and guidelines.

Jun 1st 2026
5-12 Weeks
Data Science Companion (Coursera) Coursera
MathWorks

Data Science Companion (Coursera)

The Data Science Companion provides an introduction to data science. You will gain a quick background in data science and core machine learning concepts, such as regression and classification. You’ll be introduced to the practical knowledge of data processing and visualization using low-code solutions, as well as an overview of the ways to integrate multiple tools effectively to solve data science problems.

Jun 5th 2026
4 Weeks
Advanced Algorithms and Complexity (Coursera) Coursera
University of California, San Diego,Higher School of Economics - HSE University

Advanced Algorithms and Complexity (Coursera)

You've learned the basic algorithms now and are ready to step into the area of more complex problems and algorithms to solve them. Advanced algorithms build upon basic ones and use new ideas. We will start with networks flows which are used in more typical applications such as optimal matchings, finding disjoint paths and flight scheduling as well as more surprising ones like image segmentation in computer vision.

Jun 1st 2026
5-12 Weeks
Algorithmic Toolbox (Coursera) Coursera
University of California, San Diego,Higher School of Economics - HSE University

Algorithmic Toolbox (Coursera)

The course covers basic algorithmic techniques and ideas for computational problems arising frequently in practical applications: sorting and searching, divide and conquer, greedy algorithms, dynamic programming. We will learn a lot of theory: how to sort data and how it helps for searching; how to break a large problem into pieces and solve them recursively; when it makes sense to proceed greedily; how dynamic programming is used in genomic studies. You will practice solving computational problems, designing new algorithms, and implementing solutions efficiently (so that they run in less than a second).

Jun 1st 2026
5-12 Weeks
Process Mining: Data science in Action (Coursera) Coursera
Eindhoven University of Technology

Process Mining: Data science in Action (Coursera)

Process mining is the missing link between model-based process analysis and data-oriented analysis techniques. Through concrete data sets and easy to use software the course provides data science knowledge that can be applied directly to analyze and improve processes in a variety of domains. Data science is the profession of the future, because organizations that are unable to use (big) data in a smart way will not survive. It is not sufficient to focus on data storage and data analysis. The data scientist also needs to relate data to process analysis.

Jun 1st 2026
5-12 Weeks
Foundations: Data, Data, Everywhere (Coursera) Coursera
Google

Foundations: Data, Data, Everywhere (Coursera)

This is the first course in the Google Data Analytics Certificate. These courses will equip you with the skills you need to apply to introductory-level data analyst jobs. Organizations of all kinds need data analysts to help them improve their processes, identify opportunities and trends, launch new products, and make thoughtful decisions. In this course, you’ll be introduced to the world of data analytics through hands-on curriculum developed by Google. The material shared covers plenty of key data analytics topics, and it’s designed to give you an overview of what’s to come in the Google Data Analytics Certificate. Current Google data analysts will instruct and provide you with hands-on ways to accomplish common data analyst tasks with the best tools and resources.

Jun 2nd 2026
5-12 Weeks
Share Data Through the Art of Visualization (Coursera) Coursera
Google

Share Data Through the Art of Visualization (Coursera)

This is the sixth course in the Google Data Analytics Certificate. These courses will equip you with the skills needed to apply to introductory-level data analyst jobs. You’ll learn how to visualize and present your data findings as you complete the data analysis process. This course will show you how data visualizations, such as visual dashboards, can help bring your data to life. You’ll also explore Tableau, a data visualization platform that will help you create effective visualizations for your presentations.

Jun 2nd 2026
4 Weeks
Reproducible Research (Coursera) Coursera
Johns Hopkins University

Reproducible Research (Coursera)

This course focuses on the concepts and tools behind reporting modern data analyses in a reproducible manner. Reproducible research is the idea that data analyses, and more generally, scientific claims, are published with their data and software code so that others may verify the findings and build upon them. The need for reproducibility is increasing dramatically as data analyses become more complex, involving larger datasets and more sophisticated computations.

Jun 1st 2026
4 Weeks
Python Project for Data Science (Coursera) Coursera
IBM

Python Project for Data Science (Coursera)

This mini-course is intended to for you to demonstrate foundational Python skills for working with data. The completion of this course involves working on a hands-on project where you will develop a simple dashboard using Python. This course is part of the IBM Data Science Professional Certificate and the IBM Data Analytics Professional Certificate.

Jun 4th 2026
1 Week