EdX

Data Analytics and Visualization Capstone Project (edX)

Offered by IBM,
Data Analytics and Visualization Capstone Project (edX)

Accelerate the knowledge you gain from previous courses in the IBM Data Analyst Professional Certificate program. Assume the role of an Associate Data Analyst and use various skills and techniques on real-world datasets to accomplish a task. This course provides students with the opportunity to assume the role of an Associate Data Analyst who has recently joined an organization. In this role, you will use Data Analytics skills and techniques on real-world datasets to complete a business task.

Class Deals by MOOC List - Click here and see EdX's Active Discounts, Deals, and Promo Codes.

You will gain useful experience collecting, analyzing, and preparing data to be used for making charts and constructing an interactive dashboard. The course ends with a presentation of your data analysis report that tests your ability to create a compelling story for the various stakeholders in the organization.
This course is a great way to display your Data Analytics skills and prove your proficiency to potential employers.
This course is part of the Data Analyst Professional Certificate.

What you'll learn

  • Data Collection scraping the internet, and using APIs
  • Data Wrangling using various techniques to identify duplicate rows, find missing values, and normalize data
  • Exploratory Analysis finding the distribution of data, the presence of outliers and the correlation between different columns
  • Data Visualization using developer survey data to create visualizations highlighting the distribution of data, relationships between data, and the composition and comparison of data
  • Dashboard Construction using the IBM Cognos Analytics as a platform to create a dashboard that is intuitive, appealing, and easy to understand
  • Presentations demonstrating your ability to clarify your analysis and relay your findings in a way that is easy to understand
Go to Class
MOOC List is learner-supported. When you buy through links on our site, we may earn an affiliate commission.

Related Courses

Data Science: Wrangling (edX) EdX
HarvardX,Harvard University

Data Science: Wrangling (edX)

Learn to process and convert raw data into formats needed for analysis. In this course, we cover several standard steps of the data wrangling process like importing data into R, tidying data, string processing, HTML parsing, working with dates and times, and text mining. Rarely are all these wrangling steps necessary in a single analysis, but a data scientist will likely face them all at some point.

Self Paced
Self-Paced
Analyzing and Visualizing Data with Power BI (edX) EdX
Davidson College,DavidsonX

Analyzing and Visualizing Data with Power BI (edX)

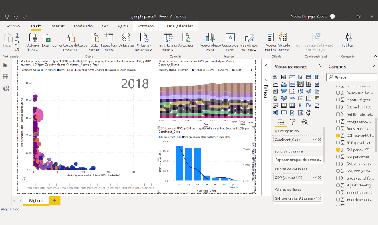
Step up your analytics game and learn one of the most in-demand job skills in the United States. Power BI is a robust business analytics and visualization tool from Microsoft that helps data professionals bring their data to life and tell more meaningful stores. This four-week course is a beginner's guide to working with data in Power BI and is perfect for professionals. You'll become confident in working with data, creating data visualizations, and preparing reports and dashboards.

Self Paced
Self-Paced
Effecting Digital Transformation with Data Analytics Projects (edX) EdX
University of Maryland, College Park,University System of Maryland - USM,USMx,UMD

Effecting Digital Transformation with Data Analytics Projects (edX)

Learn how to transform an organization digitally through simulations and case studies by applying the Disciplined Agile Delivery framework to work through three simulations. As a business leader, you may be asking yourself, what’s next? R? Python? Graph Databases? The latest data analytics technology that was launched last week? How do you craft an effective digital strategy from these technologies? How do you build the data transformation roadmap to give your organization a competitive advantage? How will you digitally transform your organization to give the best customer experience? In this course, we will explore three case studies to learn the practical tools and methods used to build a digital organization.

Self Paced
Self-Paced
Python Basics for Data Science (edX) EdX
IBM

Python Basics for Data Science (edX)

This Python course provides a beginner-friendly introduction to Python for Data Science. Practice through lab exercises, and you'll be ready to create your first Python scripts on your own! Kickstart your learning of Python for data science, as well as programming in general with this introduction to Python course. This beginner-friendly Python course will quickly take you from zero to programming in Python in a matter of hours and give you a taste of how to start working with data in Python.

Self Paced
Self-Paced
Data Representation and Visualization in Tableau (edX) EdX
Rochester Institute of Technology,RITx

Data Representation and Visualization in Tableau (edX)

Use Tableau to explore data and discover insights to innovate data-driven decision-making.Use Tableau to explore data and discover insights to innovate data-driven decision-making. Employer demand for Tableau skills will grow 35% over the next 10 years. Whether you are in a data-centric role or just need to add data skills to take your job or career to the next level, this course will provide the foundation and skills to get started using one of today’s most impactful data visualization tools.

Self Paced
Self-Paced
Analyzing Data with Excel (edX) EdX
IBM

Analyzing Data with Excel (edX)

Build the fundamental knowledge required to use Excel spreadsheets to perform basic data analysis. The course covers the basic workings and key features of Excel to help students analyze their data. This course provides students with the fundamental knowledge required to use Excel spreadsheets to perform basic data analysis.The course consists of several videos, demos, examples, and hands-on labs to help you learn, and ends with a final assignment project which will help you put what you have learned into practice.

Self Paced
Self-Paced
RShiny for Everyone (edX) EdX
Davidson College,DavidsonX

RShiny for Everyone (edX)

Use R’s Shiny package to create data-driven, interactive web applications. In this course, you will use R Shiny to create an interactive web application that highlights the biodiversity of America’s National Parks. Your application will feature an interactive map, biodiversity calculator, trail journal and species images. Using R Shiny, you will expand your data analysis and visualization skills while developing your workflow through web application deployment.

Self Paced
Self-Paced
Storytelling and Persuading using Data and Digital Technologies (edX) EdX
University of Maryland, College Park,University System of Maryland - USM,USMx,UMD

Storytelling and Persuading using Data and Digital Technologies (edX)

Learn how to gain traction for your digital transformation initiatives with stories based on data that use compelling data visualizations to build a persuasive business case. Decisions made by humans are rarely made by data alone. Human decision-makers have cognitive biases, are affected by emotions, and make conceptual leaps beyond what the data may suggest.

Self Paced
Self-Paced
Visualizing Data with Python (edX) EdX
IBM

Visualizing Data with Python (edX)

Data visualization is the graphical representation of data in order to interactively and efficiently convey insights to clients, customers, and stakeholders in general. "A picture is worth a thousand words." We are all familiar with this expression. It especially applies when trying to explain the insights obtained from the analysis of increasingly large datasets. Data visualization plays an essential role in the representation of both small and large-scale data. One of the key skills of a data scientist is the ability to tell a compelling story, visualizing data and findings in an approachable and stimulating way.

Self Paced
Self-Paced
Data Science: Capstone (edX) EdX
HarvardX,Harvard University

Data Science: Capstone (edX)

Show what you’ve learned from the Professional Certificate Program in Data Science. To become an expert data scientist you need practice and experience. By completing this capstone project you will get an opportunity to apply the knowledge and skills in R data analysis that you have gained throughout the series. This final project will test your skills in data visualization, probability, inference and modeling, data wrangling, data organization, regression, and machine learning.

Self Paced
Self-Paced