EdX

Visualizando datos con Python (edX)

Offered by IBM,
Visualizando datos con Python (edX)

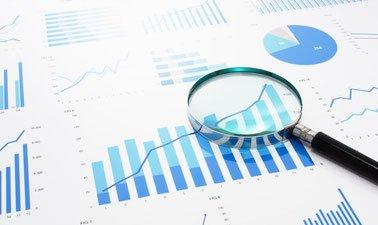
La visualización de datos es la representación gráfica de los datos para transmitir de manera interactiva y eficiente las ideas a los clientes y partes interesadas en general.

Class Deals by MOOC List - Click here and see EdX's Active Discounts, Deals, and Promo Codes.

"Una imagen vale más que mil palabras." Todos estamos familiarizados con esta expresión. Se aplica especialmente cuando se trata de explicar las ideas obtenidas del análisis de conjuntos de datos cada vez más grandes. La visualización de datos juega un papel esencial en la representación de datos tanto a pequeña como a gran escala.
Una de las habilidades clave de un científico de datos es la capacidad de contar una historia convincente, visualizar datos y hallazgos de una manera accesible y estimulante.
En este curso, aprenderás cómo aprovechar una herramienta de software para visualizar datos que también te permitirán extraer información, comprender mejor los datos y tomar decisiones más efectivas.
Cuando te registras en este curso, obtienes acceso gratuito a IBM Watson Studio. En Watson Studio, podrás comenzar a crear tus propios proyectos de ciencia de datos y colaborar con otros científicos de datos. ¡Comienza ahora y aprovecha todo lo que esta plataforma tiene para ofrecer!
Ten en cuenta que los foros de discusión de este curso están abiertos para que los estudiantes publiquen y se comuniquen entre sí. Sin embargo, los foros ya no serán supervisados por el equipo de IBM. Las preguntas técnicas relacionadas con tu experiencia en el curso deben dirigirse al equipo de soporte de edX a través de la información de contacto proporcionada en el curso. Gracias.
This course is part of the Ciencia de datos con Python Professional Certificate and IBM: Ciencia de datos Professional Certificate.
What you'll learn

  • Cómo presentar datos usando algunas de las bibliotecas de visualización de datos en Python, incluyendo Matplotlib, Seaborn y Folium
  • Cómo usar las herramientas básicas de visualización, que incluyen gráficos de área, histogramas y gráficos de barras
  • Cómo usar herramientas de visualización especializadas, incluidos gráficos circulares, gráficos de caja, gráficos de dispersión y gráficos de burbujas
  • Cómo usar herramientas de visualización avanzadas, que incluyen gráficos de Waffle, nubes de palabras y gráficos de regresión y Seaborn
  • Cómo crear mapas y ver datos geoespaciales
Go to Class
MOOC List is learner-supported. When you buy through links on our site, we may earn an affiliate commission.

Related Courses

Statistical Predictive Modelling and Applications (edX) EdX
University of Edinburgh,EdinburghX

Statistical Predictive Modelling and Applications (edX)

Learn how to apply statistical modelling techniques to real-world business scenarios using Python. In this course, you will learn three predictive modelling techniques - linear and logistic regression, and naive Bayes - and their applications in real-world scenarios. The first half of the course focuses on linear regression. This technique allows you to model a continuous outcome variable using both continuous and categorical predictors. This technique enables you to predict product sales based on several customer variables.

Jan 18th 2022
5-12 Weeks
CS50's Introduction to Artificial Intelligence with Python (edX) EdX
HarvardX,Harvard University

CS50's Introduction to Artificial Intelligence with Python (edX)

Learn to use machine learning in Python in this introductory course on artificial intelligence. AI is transforming how we live, work, and play. By enabling new technologies like self-driving cars and recommendation systems or improving old ones like medical diagnostics and search engines, the demand for expertise in AI and machine learning is growing rapidly. This course will enable you to take the first step toward solving important real-world problems and future-proofing your career.

Self Paced
Self-Paced
Stochastic Processes: Data Analysis and Computer Simulation (edX) EdX
Kyoto University,KyotoUx

Stochastic Processes: Data Analysis and Computer Simulation (edX)

The course deals with how to simulate and analyze stochastic processes, in particular the dynamics of small particles diffusing in a fluid. The motion of falling leaves or small particles diffusing in a fluid is highly stochastic in nature. Therefore, such motions must be modeled as stochastic processes, for which exact predictions are no longer possible. This is in stark contrast to the deterministic motion of planets and stars, which can be perfectly predicted using celestial mechanics.

This course is archived
5-12 Weeks
Data Analysis: Statistical Modeling and Computation in Applications (edX) EdX
MIT,MITx

Data Analysis: Statistical Modeling and Computation in Applications (edX)

A hands-on introduction to the interplay between statistics and computation for the analysis of real data. -- Part of the MITx MicroMasters program in Statistics and Data Science. Data science requires multi-disciplinary skills ranging from mathematics, statistics, machine learning, problem solving to programming, visualization, and communication skills. In this course, learners will combine these foundational and practical skills with domain knowledge to ask and answer questions using real data.

May 13th 2024
13-24 Weeks
Computing for Data Analysis (edX) EdX
Georgia Institute of Technology,GTx

Computing for Data Analysis (edX)

A hands-on introduction to basic programming principles and practice relevant to modern data analysis, data mining, and machine learning. The modern data analysis pipeline involves collection, preprocessing, storage, analysis, and interactive visualization of data. In the course, you’ll see how computing and mathematics come together.

Aug 19th 2024
13-24 Weeks
Análisis de datos: Diseño y Visualización de Tableros (edX) EdX
Delft University of Technology,DelftX

Análisis de datos: Diseño y Visualización de Tableros (edX)

Aprende cómo transformar datos sin procesar, con el uso de tableros en Excel, para apoyar las decisiones de negocio. ¿Luchando con los datos en tu trabajo? ¿Gastando tiempo valioso trabajando en muchas hojas de cálculo en Excel para obtener un resumen de tu negocio? ¿Tienes dificultades para obtener un tablero detallado a partir de montones de datos en tu escritorio? ¿Quieres entender cómo analizar Big Data?

Self Paced
Self-Paced
Statistics Using Python (edX) EdX
University of Wisconsin–Madison,WisconsinX

Statistics Using Python (edX)

Learn the fundamentals of statistics using Python. This course is a compact primer in statistics as a foundation for data-driven business analysis. A selection of concepts include descriptive statistics, probability, inference, correlation, and regression. The course also exposes students to basic Python programming for use in statistics.

Jan 23rd 2024
5-12 Weeks
CS For All: Introduction to Computer Science and Python Programming (edX) EdX
Harvey Mudd College,HarveyMuddX

CS For All: Introduction to Computer Science and Python Programming (edX)

A fun, fast-paced introduction to solving interesting problems with computer science through Python programming. Looking to get started with computer science while learning to program in Python? This computer science course provides an introduction to computer science that’s both challenging and fun.

No sessions available
13-24 Weeks
Statistical Thinking for Data Science and Analytics (edX) EdX
Columbia University,ColumbiaX

Statistical Thinking for Data Science and Analytics (edX)

Learn how statistics plays a central role in the data science approach. This statistics and data analysis course will pave the statistical foundation for our discussion on data science. You will learn how data scientists exercise statistical thinking in designing data collection, derive insights from visualizing data, obtain supporting evidence for data-based decisions and construct models for predicting future trends from data.

Self Paced
Self-Paced