Creating an Analytical Dataset (Udacity)

Offered by Udacity, Alteryx,
Creating an Analytical Dataset (Udacity)

Prepare data for analysis and modeling. The Creating an Analytical Dataset course provides students with foundational knowledge to input, clean, blend, and format data in preparation for analysis.

Class Deals by MOOC List - Click here and see Udacity's Active Discounts, Deals, and Promo Codes.

You will learn:

  • The common sources and types of data
  • To identify and correct common issues with data
  • To format data in useful ways for analysis
  • To blend data from multiple sources together

Throughout this course you’ll also learn the techniques to apply your knowledge in a data analytics program called Alteryx. At the end of the course, you’ll complete a project based on the principles in the course..
Udacity's Intro to Programming is your first step towards careers in Web and App Development, Machine Learning, Data Science, AI, and more! This program is perfect for beginners.
Ever heard of the term garbage in, garbage out? This is as true in analytics as it is anywhere else. In this course, you’ll learn how to prepare data to ensure the efficacy of your analysis, a foundational skill for anyone using advanced analytics. You'll learn this through improving your fluency in Alteryx, a data analytics tool that enables you prepare, blend, and analyze data quickly. This course is ideal for anyone who is interested in pursuing a career in business analysis, but lacks programming experience.
This course is part of the Business Analyst Nanodegree Program.

What You Will Learn

Lesson 1
Understanding Data

  • Learn to identify structured, unstructured, and semistructured data.
  • Get an introduction to the most common data types.
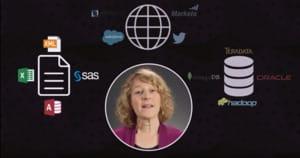
  • Learn about the most common sources of data.

Lesson 2
Data Issues

  • Learn to clean dirty data.
  • Learn to how to adjust for missing data.
  • Be able to identify and correct outliers.

Lesson 3
Data Formatting

  • Learn about the importance of data format for analysis.
  • Transpose, aggregate, and cross tabulate data.
  • Learn how to use parse data.

Lesson 4
Data Blending

  • Learn how to merge data from multiple sources.
  • Learn to use common data blending techniques.
  • Explore fuzzy matching and spatial analysis

Prerequisites and Requirements

  • No programming experience required
  • Interested in using data to make better business decisions
  • Alteryx license (provided to nanodegree students at no cost, compatible with Windows only)
Go to Class
MOOC List is learner-supported. When you buy through links on our site, we may earn an affiliate commission.

Related Courses

Visualization for Data Journalism (Coursera) Coursera
University of Illinois at Urbana-Champaign

Visualization for Data Journalism (Coursera)

While telling stories with data has been part of the news practice since its earliest days, it is in the midst of a renaissance. Graphics desks which used to be deemed as “the art department,” a subfield outside the work of newsrooms, are becoming a core part of newsrooms’ operation. Those people (they often have various titles: data journalists, news artists, graphic reporters, developers, etc.) who design news graphics are expected to be full-fledged journalists and work closely with reporters and editors.

Oct 5th 2026
5-12 Weeks
Improving Your Statistical Questions (Coursera) Coursera
Eindhoven University of Technology

Improving Your Statistical Questions (Coursera)

This course aims to help you to ask better statistical questions when performing empirical research. We will discuss how to design informative studies, both when your predictions are correct, as when your predictions are wrong. We will question norms, and reflect on how we can improve research practices to ask more interesting questions.

Oct 5th 2026
5-12 Weeks
Real-Time Analytics with Apache Storm (Udacity) Udacity
Udacity,Twitter

Real-Time Analytics with Apache Storm (Udacity)

The world is trending in real time! Learn from Twitter to scalably process tweets, or any big data stream, in real-time to drive d3 visualizations using Apache Storm, the "Hadoop of Real Time." Storm is free, open source, and fun to use! Learn from Karthik Ramasamy, about the distributed, fault-tolerant, and flexible technology used to power Twitter’s real-time data flow pipeline. Twitter open sourced Storm in 2011, and it graduated to a top-level Apache project in September, 2014.

Self Paced
Self-Paced
Spatial Data Science and Applications (Coursera) Coursera
Yonsei University

Spatial Data Science and Applications (Coursera)

Spatial (map) is considered as a core infrastructure of modern IT world, which is substantiated by business transactions of major IT companies such as Apple, Google, Microsoft, Amazon, Intel, and Uber, and even motor companies such as Audi, BMW, and Mercedes. Consequently, they are bound to hire more and more spatial data scientists. Based on such business trend, this course is designed to present a firm understanding of spatial data science to the learners, who would have a basic knowledge of data science and data analysis, and eventually to make their expertise differentiated from other nominal data scientists and data analysts.

Oct 5th 2026
5-12 Weeks
Bayesian Statistics: Techniques and Models (Coursera) Coursera
University of California, Santa Cruz

Bayesian Statistics: Techniques and Models (Coursera)

This is the second of a two-course sequence introducing the fundamentals of Bayesian statistics. It builds on the course Bayesian Statistics: From Concept to Data Analysis, which introduces Bayesian methods through use of simple conjugate models. Real-world data often require more sophisticated models to reach realistic conclusions. This course aims to expand our “Bayesian toolbox” with more general models, and computational techniques to fit them.

Oct 5th 2026
5-12 Weeks
Data Visualization with Tableau Project (Coursera) Coursera
University of California, Davis

Data Visualization with Tableau Project (Coursera)

In this project-based course, you will follow your own interests to create a portfolio worthy single-frame viz or multi-frame data story that will be shared on Tableau Public. You will use all the skills taught in this Specialization to complete this project step-by-step, with guidance from your instructors along the way.

Oct 5th 2026
5-12 Weeks
Probability and Statistics: To p or not to p? (Coursera) Coursera
University of London

Probability and Statistics: To p or not to p? (Coursera)

We live in an uncertain and complex world, yet we continually have to make decisions in the present with uncertain future outcomes. Indeed, we should be on the look-out for "black swans" - low-probability high-impact events. To study, or not to study? To invest, or not to invest? To marry, or not to marry?

Oct 5th 2026
5-12 Weeks
GIS Data Formats, Design and Quality (Coursera) Coursera
University of California, Davis

GIS Data Formats, Design and Quality (Coursera)

In this course, the second in the Geographic Information Systems (GIS) Specialization. What you will learn: design data tables and use separating and joining data in a relational database; write query strings to subset data; create and work with raster data; create web maps.

Sep 14th 2026
4 Weeks
Data Analysis with R (Udacity) Udacity
Udacity,Facebook

Data Analysis with R (Udacity)

Visually Analyze and Summarize Data Sets. Exploratory data analysis is an approach for summarizing and visualizing the important characteristics of a data set. Promoted by John Tukey, exploratory data analysis focuses on exploring data to understand the data’s underlying structure and variables, to develop intuition about the data set, to consider how that data set came into existence, and to decide how it can be investigated with more formal statistical methods.

Self Paced
Self-Paced