EdX

Análisis de datos: Diseño y Visualización de Tableros (edX)

Análisis de datos: Diseño y Visualización de Tableros (edX)

Aprende cómo transformar datos sin procesar, con el uso de tableros en Excel, para apoyar las decisiones de negocio. ¿Luchando con los datos en tu trabajo? ¿Gastando tiempo valioso trabajando en muchas hojas de cálculo en Excel para obtener un resumen de tu negocio? ¿Tienes dificultades para obtener un tablero detallado a partir de montones de datos en tu escritorio? ¿Quieres entender cómo analizar Big Data?

Class Deals by MOOC List - Click here and see EdX's Active Discounts, Deals, and Promo Codes.

Si estás buscando mejorar tu eficiencia en la oficina y aumentar tu rendimiento mediante una forma más rápida e inteligente de darle sentido a los datos, utilizando diferentes técnicas de análisis de datos, entonces este curso avanzado de análisis de datos es para ti.
Si ya tienes habilidades con las hojas de cálculo, este curso te ayudará a profundizar tus conocimientos aún más. Aprenderás técnicas avanzadas para un análisis de datos robusto en el ambiente de los negocios. Este curso cubre las principales tareas requeridas hoy por los analistas de datos y Big Data, incluyendo importar, resumir, interpretar, analizar y visualizar datos. Este curso de análisis de datos y estadísticas busca entregarte las herramientas que te permitan ser un analista de datos independiente y exitoso. La mayoría de las técnicas se enseñarán en Microsoft Excel con extensiones y herramientas gratuitas disponibles en línea. Te invitamos a utilizar tus propios datos en este curso, pero si no están disponibles, el equipo del curso puede proveértelos.
Este curso es parte del Programa de Certificación Profesional Análisis y Visualización de Datos con Excel.

What you'll learn

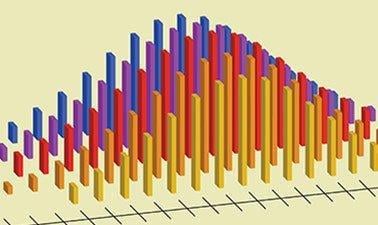
  • Cómo hacer que los datos cobren vida por medio de tipos de visualizaciones conocidas como gráficos de líneas y barras y nuevos tipos de visualizaciones como líneas de tendencia, gráfico de superficie y pirámides de población
  • Cómo crear tableros en Microsoft Excel basados en datos reales que pueden cubrir necesidades de gestión y de negocio
  • Cómo conectar datos desde distintos orígenes, como la web y extracciones de tu CRM, ERP, SAP o datawarehouse
  • Algunas prácticas de ciencias de datos y cómo utilizar herramientas de análisis viables
  • Profundizar en herramientas estadísticas conocidas como Tablas Dinámicas e introducir nuevas como herramientas para el análisis de los datos
Go to Class
MOOC List is learner-supported. When you buy through links on our site, we may earn an affiliate commission.

Related Courses

Computing for Data Analysis (edX) EdX
Georgia Institute of Technology,GTx

Computing for Data Analysis (edX)

A hands-on introduction to basic programming principles and practice relevant to modern data analysis, data mining, and machine learning. The modern data analysis pipeline involves collection, preprocessing, storage, analysis, and interactive visualization of data. In the course, you’ll see how computing and mathematics come together.

Aug 19th 2024
13-24 Weeks
Analyzing and Visualizing Data with Power BI (edX) EdX
Davidson College,DavidsonX

Analyzing and Visualizing Data with Power BI (edX)

Step up your analytics game and learn one of the most in-demand job skills in the United States. Power BI is a robust business analytics and visualization tool from Microsoft that helps data professionals bring their data to life and tell more meaningful stores. This four-week course is a beginner's guide to working with data in Power BI and is perfect for professionals. You'll become confident in working with data, creating data visualizations, and preparing reports and dashboards.

Self Paced
Self-Paced
Excel: fundamentos y herramientas (edX) EdX
Universitat Politècnica de València,UPValenciaX

Excel: fundamentos y herramientas (edX)

En este curso de Excel aprenderás las herramientas más habituales, desde lo más básico a los gráficos, formulas, funciones y tablas de datos. Conoceras cómo beneficiarte de las capacidades de este programa de Microsoft. Este es un curso de Excel basico en el que aprenderas a trabajar con este programa informatico de Microsoft, el componente para hojas de cálculo de la suite ofimática de Microsoft, MS-Office.

Self Paced
Self-Paced
Enabling Technologies for Data Science and Analytics: The Internet of Things (edX) EdX
Columbia University,ColumbiaX

Enabling Technologies for Data Science and Analytics: The Internet of Things (edX)

Discover the relationship between Big Data and the Internet of Things (IoT). The Internet of Things is rapidly growing. It is predicted that more than 25 billion devices will be connected by 2020. In this data science course, you will learn about the major components of the Internet of Things and how data is acquired from sensors. You will also examine ways of analyzing event data, sentiment analysis, facial recognition software and how data generated from devices can be used to make decisions.

Self Paced
Self-Paced
Data Analysis Essentials (edX) EdX
Imperial College Business School,Imperial College London

Data Analysis Essentials (edX)

Discover and acquire the quantitative data analysis skills that you will typically need to succeed on an MBA program. This course will cover the fundamentals of collecting, presenting, describing and making inferences from sets of data. Want to study for an MBA but unsure of the basic data analysis still required? This online course prepares you for studying in an MBA program.

Self Paced
Self-Paced
Introduction to Linear Models and Matrix Algebra (edX) EdX
HarvardX,Harvard University

Introduction to Linear Models and Matrix Algebra (edX)

Learn to use R programming to apply linear models to analyze data in life sciences. Matrix Algebra underlies many of the current tools for experimental design and the analysis of high-dimensional data. In this introductory data analysis course, we will use matrix algebra to represent the linear models that commonly used to model differences between experimental units. We perform statistical inference on these differences. Throughout the course we will use the R programming language.

Self Paced
Self-Paced
Probability: Distribution Models & Continuous Random Variables (edX) EdX
Purdue University,PurdueX

Probability: Distribution Models & Continuous Random Variables (edX)

Learn about probability distribution models, including normal distribution, and continuous random variables to prepare for a career in information and data science. In this statistics and data analysis course, you will learn about continuous random variables and some of the most frequently used probability distribution models including, exponential distribution, Gamma distribution, Beta distribution, and most importantly, normal distribution.

No sessions available
5-12 Weeks
Foundations of Data Analysis - Part 1: Statistics Using R (edX) EdX
University of Texas at Austin,UTAustinX

Foundations of Data Analysis - Part 1: Statistics Using R (edX)

This is a hands on course with a data lab to teach fundamental statistical topics such as descriptive statistics, inferential testing, and modeling. In this first part of a two part course, we’ll walk through the basics of statistical thinking – starting with an interesting question. Then, we’ll learn the correct statistical tool to help answer our question of interest – using R and hands-on Labs.

No sessions available
5-12 Weeks
Designing and Running Randomized Evaluations (edX) EdX
MIT,MITx

Designing and Running Randomized Evaluations (edX)

Learn how to both design randomized evaluations and implement them in the field to measure the impact of social programs. A randomized evaluation, also known as a randomized controlled trial (RCT), field experiment or field trial, is a type of impact evaluation that uses random assignment to allocate resources, run programs, or apply policies as part of the study design.

Sep 7th 2021
5-12 Weeks