EdX

Data Storage and Processing (edX)

Offered by ITMO University, ITMOx,
Data Storage and Processing (edX)

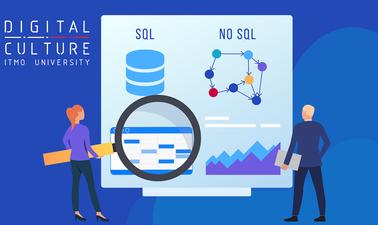
Master the culture of data representation, interpretation and outcomes evaluation. Learn the fundamentals of relational and NoSQL database management systems. Want to learn data processing and interpreting the result you’ve got? This course is for you! Get acquainted with preparing and analyzing large amount of data, as well as data storage fundamentals.

Class Deals by MOOC List - Click here and see EdX's Active Discounts, Deals, and Promo Codes.

This course is an introduction to initial data processing. We will start with data types and sources, methods of data preparation: cleaning, filling in the missing values, data smoothing and normalization. The course will familiarize you with the descriptive statistics and data visualization methods. You will also learn how to analyze time series and find trends.
Get acquainted with the fundamentals of data storage and access: databases types, relational and NoSQL databases, big data initials.
No previous programming knowledge needed.
This course is part of the Data Processing and Analysis Professional Certificate.

What you'll learn

  • Initial data processing (data cleaning and filling in the missing values)
  • Data smoothing and normalization
  • Data visualization
  • Time series analysis
  • Descriptive statistics
  • Data storage and access by means of relational DBMS
  • NoSQL databases and Big data

Syllabus

Week 1:Data preprocessing. Basic concepts of data processing. Stages of data analysis (collection, sorting, transformation, building models and interpretation). Data measurements and scales. Data types and sources. Data preparing.

Week 2:Data processing tools and visualization. Digital spreadsheets. Data visualization goals. Methods and purposes of correct data visualization.

Week 3: Data processing. Descriptive statistics. Data normalization and transformation. Time-series analysis and forecasting. Types of time-series smoothing. Trends, seasonal time series modelling.

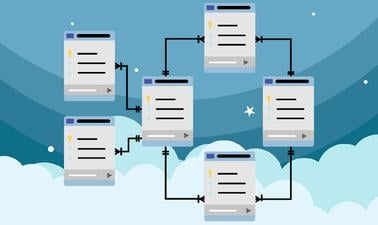
Week 4:Relational databases management systems. Introduction to relational DBMS starting from relational data model. SQL statements and queries creation. Database indexes and transactions requirements.

Week 5:NoSQL. Main characteristics of not only SQL databases. Non-structured and semi-structured data and scalability of NoSQL databases. Types of NoSQL databases: column-oriented, key-value store, document store and graph databases.

Go to Class
MOOC List is learner-supported. When you buy through links on our site, we may earn an affiliate commission.

Related Courses

Big Data Fundamentals (edX) EdX
University of Adelaide,AdelaideX

Big Data Fundamentals (edX)

Learn how big data is driving organisational change and essential analytical tools and techniques, including data mining and PageRank algorithms. Organizations now have access to massive amounts of data and it’s influencing the way they operate. They are realizing in order to be successful they must leverage their data to make effective business decisions.

Self Paced
Self-Paced
Unix Tools: Data, Software and Production Engineering (edX) EdX
Delft University of Technology,DelftX

Unix Tools: Data, Software and Production Engineering (edX)

Grow from being a Unix novice to Unix wizard status! Process big data, analyze software code, run DevOps tasks and excel in your everyday job through the amazing power of the Unix shell and command-line tools. Processing information is the hallmark of all modern organizations, which are increasingly digital: absorbing, processing and generating information is a key element of their business.

Self Paced
Self-Paced
Analyzing Data with Excel (edX) EdX
IBM

Analyzing Data with Excel (edX)

Build the fundamental knowledge required to use Excel spreadsheets to perform basic data analysis. The course covers the basic workings and key features of Excel to help students analyze their data. This course provides students with the fundamental knowledge required to use Excel spreadsheets to perform basic data analysis.The course consists of several videos, demos, examples, and hands-on labs to help you learn, and ends with a final assignment project which will help you put what you have learned into practice.

Self Paced
Self-Paced
Minería de Datos: Segmentación de Mercados (edX) EdX
Universidad Anáhuac,AnahuacX

Minería de Datos: Segmentación de Mercados (edX)

¿Conoces realmente a tus clientes? En este curso aprenderás a construir modelos basados en técnicas de minería de datos, que te permitirán descubrir los hábitos de compra de tus clientes, para definir estrategias de marketing de acuerdo con sus perfiles, hacer una correcta toma de decisiones y tener una ventaja competitiva a través de herramientas de minería de datos.

Self Paced
Self-Paced
Big Data Capstone Project (edX) EdX
University of Adelaide,AdelaideX

Big Data Capstone Project (edX)

Further develop your knowledge of big data by applying the skills you have learned to a real-world data science project. This project will give you the opportunity to deepen your learning by giving you valuable experience in evaluating, selecting and applying relevant data science techniques, principles and theory to a data science problem. This project will see you plan and execute a reasonably substantial project and demonstrate autonomy, initiative and accountability.

Self Paced
Self-Paced
Storytelling and Persuading using Data and Digital Technologies (edX) EdX
University of Maryland, College Park,University System of Maryland - USM,USMx,UMD

Storytelling and Persuading using Data and Digital Technologies (edX)

Learn how to gain traction for your digital transformation initiatives with stories based on data that use compelling data visualizations to build a persuasive business case. Decisions made by humans are rarely made by data alone. Human decision-makers have cognitive biases, are affected by emotions, and make conceptual leaps beyond what the data may suggest.

Self Paced
Self-Paced
Data Processing and Analysis with Excel (edX) EdX
Rochester Institute of Technology,RITx

Data Processing and Analysis with Excel (edX)

Learn to use Excel to organize and clean data so it can be manipulated and analyzed. In this course, you will learn how to organize your data within the Microsoft Office Excel software tool. Once organized, we will discuss data cleaning. You will learn how to identify outliers and anomalies in the data, and how to identify and change data-types. Together we will develop a data analysis plan, after which we will apply analysis methods and tools, including exploratory analysis, evaluation of results, and comparison with other findings.

Self Paced
Self-Paced
Introduction to Computer Science and Programming (edX) EdX
Tokyo Institute of Technology,TokyoTechX

Introduction to Computer Science and Programming (edX)

The term “Computation” refers to the action performed by a computer. A computation can be a basic operation and it can also be a sophisticated computer simultation requiring a large amount of data and substantial resources. This course aims at introducing learners with no prior knowledge to basics and key concepts of computer science. By following the lectures and exercises of this course you will have an understanding of algorithms and you will get a real experience of programming using the language Ruby.

Self Paced
Self-Paced
Visualizing Data with R (edX) EdX
IBM

Visualizing Data with R (edX)

Learn about the ggplot2 data visualization package for R, creating map plots with geolocation data using Leaflet, and interactive dashboards to display your work on the web using the R Shiny package! In this course, you will learn about the Grammar of Graphics, a system for describing and building graphs, and how the ggplot2 data visualization package for R applies this concept to basic bar charts, histograms, pie charts, scatter plots, line plots, and box plots.

Self Paced
Self-Paced
RShiny for Everyone (edX) EdX
Davidson College,DavidsonX

RShiny for Everyone (edX)

Use R’s Shiny package to create data-driven, interactive web applications. In this course, you will use R Shiny to create an interactive web application that highlights the biodiversity of America’s National Parks. Your application will feature an interactive map, biodiversity calculator, trail journal and species images. Using R Shiny, you will expand your data analysis and visualization skills while developing your workflow through web application deployment.

Self Paced
Self-Paced