Johns Hopkins University

Sort options

Introduction to the Tidyverse (Coursera)

This course introduces a powerful set of data science tools known as the Tidyverse. The Tidyverse has revolutionized the way in which data scientists do almost every aspect of their job. We will cover the simple idea of "tidy data" and how this idea serves to organize data for [...]

Public Health Perspectives on Sustainable Diets (Coursera)

Apr 22nd 2024
Public Health Perspectives on Sustainable Diets (Coursera)
Course Auditing
Categories
Effort
Languages
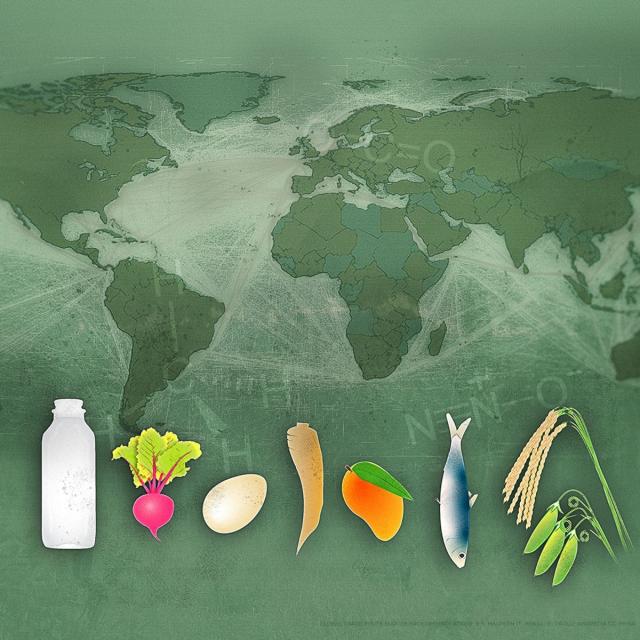
What we eat and how we produce that food have significant effects on human health and the sustainability of our planet. But what is a ‘sustainable’ diet? A sustainable diet, as defined by the FAO, promotes health and well-being and provides food security for the present population while [...]

What are the Chances? Probability and Uncertainty in Statistics (Coursera)

Apr 22nd 2024
What are the Chances? Probability and Uncertainty in Statistics (Coursera)
Course Auditing
Categories
Effort
Languages
This course focuses on how analysts can measure and describe the confidence they have in their findings. The course begins with an overview of the key probability rules and concepts that govern the calculation of uncertainty measures. We’ll then apply these ideas to variables (which are the [...]

Publishing Visualizations in R with Shiny and flexdashboard (Coursera)

This course is the fourth in the Specialization "Data Visualization and Dashboarding in R." Learners will come to this course with a strong background in making visualization in R using ggplot2. To build on those skills, this course covers creating interactive visualization using Shiny, as well as combining different [...]

Getting Started with Data Visualization in R (Coursera)

Data visualization is a critical skill for anyone that routinely using quantitative data in his or her work - which is to say that data visualization is a tool that almost every worker needs today. One of the critical tools for data visualization today is the R statistical programming [...]

Advanced Data Visualization with R (Coursera)

Data visualization is a critical skill for anyone that routinely using quantitative data in his or her work - which is to say that data visualization is a tool that almost every worker needs today. One of the critical tools for data visualization today is the R statistical programming [...]

Quantifying Relationships with Regression Models (Coursera)

This course will introduce you to the linear regression model, which is a powerful tool that researchers can use to measure the relationship between multiple variables. We’ll begin by exploring the components of a bivariate regression model, which estimates the relationship between an independent and dependent variable. [...]

Measurement – Turning Concepts into Data (Coursera)

This course provides a framework for how analysts can create and evaluate quantitative measures. Consider the many tricky concepts that are often of interest to analysts, such as health, educational attainment and trust in government. This course will explore various approaches for quantifying these concepts. The [...]

Data – What It Is, What We Can Do With It (Coursera)

This course introduces students to data and statistics. By the end of the course, students should be able to interpret descriptive statistics, causal analyses and visualizations to draw meaningful insights. The course first introduces a framework for thinking about the various purposes of statistical analysis. We’ll talk [...]

Precalculus: Mathematical Modeling (Coursera)

Apr 22nd 2024
Precalculus: Mathematical Modeling (Coursera)
Course Auditing
Categories
Effort
Languages
This course helps to build the foundational material to use mathematics as a tool to model, understand, and interpret the world around us. This is done through studying functions, their properties, and applications to data analysis. Concepts of precalculus provide the set of tools for the beginning [...]